RealSense 學習筆記/教學/分享(三):幀的控制
前面那篇在機器的控制端準備好了之後,接收到的資料要怎麼處理呢?
就讓我在這篇裡面介紹
主要本篇在於視覺化 用opencv為主
適用的範例是這個:
https://github.com/soarwing52/RealsensePython/blob/master/phase%201/read_bag.py
在上一篇的設定好了之後,就用可以看第一篇裡面的表格
dec = rs.decimation_filter(1)
to_dasparity = rs.disparity_transform(True)
dasparity_to = rs.disparity_transform(False)
spat = rs.spatial_filter()
spat.set_option(RS2_OPTION_HOLES_FILL, 5)
hole = rs.hole_filling_filter(2)
temp = rs.temporal_filter()
depth_dis = to_dasparity.process(depth)
depth_spat = spat.process(depth_dis)
depth_temp = temp.process(depth_spat)
depth_hole = hole.process(depth_temp)
depth_final = dasparity_to.process(depth_hole)
接下來我的程式碼裡面就是一些幀的資料
var = rs.frame.get_frame_number(color_frame)
print 'frame number: '+ str(var)
time_stamp = rs.frame.get_timestamp(color_frame)
time = datetime.now()
print 'timestamp: ' + str(time_stamp)
domain = rs.frame.get_frame_timestamp_domain(color_frame)
print domain
meta = rs.frame.get_data(color_frame)
print 'metadata: ' + str(meta)
from matplotlib import pyplot as plt
plt.imshow(img)
plt.show()
就讓我在這篇裡面介紹
主要本篇在於視覺化 用opencv為主
適用的範例是這個:
https://github.com/soarwing52/RealsensePython/blob/master/phase%201/read_bag.py
在上一篇的設定好了之後,就用可以看第一篇裡面的表格
poll_for_frames()
|
回傳配對好的畫面,沒有配對就回傳Null
只要加上
if not depth_frame or not color_frame:
continue
即可在Null時避免接下來的錯誤
|
wait_for_frames()
|
他會獲取一幀之後暫停串流,然後直到獲取下一幀
不過我使用結果之後,在深度跟RGB影像配對上出了問題
他會取上一幀跟下一幀 不過我每幀都隔10秒不能用
|
try_wait_for_frames
|
這個應該就是在wait_for_frames上面再多加一個等待的秒數
沒有實測過
|
基本上如果在讀檔的時候就會讀到重覆的幀
第一次第二次黃色 然後藍色 綠色 紅色這樣取
在當影片的時候完全沒問題,不過我當作相機的時候就不能這樣了
而且當我測量的時候,畫面A但是深度B對不起來根本量到的東西不一樣阿!
我是把深度跟畫面疊在一起,還有取到雙方的秒數來配對後發現的
timestamp
|
Frame number
|
Fream number
|
timestamp
|
402204.595
|
Depth243
|
Color 274
|
402204.221
|
403104.714
|
Depth 270
|
Color 301
|
403104.941
|
404171.521
|
Depth 302
|
Color306
|
403271.741
|
406038.434
|
Depth359
|
Color333
|
404172.461
|
407305.267
|
Depth 397
|
Color 389
|
406040.621
|
407338.605
|
Depth398
|
Color 427
|
407308.301
|
408038.697
|
Depth419
|
Color 449
|
408042.221
|
409238.855
|
Depth 455
|
Color 485
|
409243.181
|
409938.947
|
Depth476
|
Color 506
|
409943.741
|
410705.715
|
Depth 499
|
Color 529
|
410711.021
|
不過,先回到基本的視覺化處理
雖然彩色深度都用1280*720,還是會有些微不同,兩個鏡頭的畫面大小不太一樣,更何況彩色可以到1920*1080
所以要先把圖對在一起
在github討論串有人問為甚麼不自動對齊,主要原因由專案負責人Dordinic回答了
在做2D畫面的時候是把深度疊進彩色
但是在做3D模型 point cloud的時候就要把彩色疊到深度上面
所以交給使用者來決定(尤其這是一個開發者導向的產品)
下圖為把兩個疊合在一起的畫面 深度1280*720 RGB1980*1080
下圖為把兩個疊合在一起的畫面 深度1280*720 RGB1980*1080
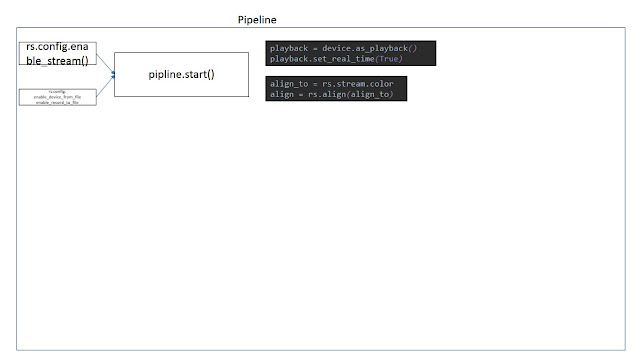
align_to = rs.stream.color # or also depth
align = rs.align(align_to)
然後在while loop裡面
frames = pipeline.wait_for_frames()
aligned_frames = align.process(frames)
於是這樣幾行就可以疊出正確的圖作為接下來運算的標準
記得要在前面enable stream
獲取資料後,把他們轉成物件object
depth_frame = frame.get_depth_frame()
color_frame = frame.get_color_frame()
有一個 rs.composite_frames()
我還不知道怎麼用
還有看到用 get_data().first_depth_sensor()
濾鏡Fileters
接下來就是之前在第一篇裡面提到的 post-processing
官方說明文件在這裡:
https://github.com/IntelRealSense/librealsense/blob/master/doc/post-processing-filters.md
對我最重要的是hole filling 把整個畫面都有數值
不過其實做到現在反而我都還沒有放,等到實地測量的資料更多再視情況
因為官方說這是一個很粗暴的填滿,反而會失準
總之,選項就跟viewer裡面看的到的一樣
to_dasparity = rs.disparity_transform(True)
dasparity_to = rs.disparity_transform(False)
spat = rs.spatial_filter()
spat.set_option(RS2_OPTION_HOLES_FILL, 5)
hole = rs.hole_filling_filter(2)
temp = rs.temporal_filter()
先在loop前定義好濾鏡
然後在裡面套用
depth = dec.process(depth_frame)depth_dis = to_dasparity.process(depth)
depth_spat = spat.process(depth_dis)
depth_temp = temp.process(depth_spat)
depth_hole = hole.process(depth_temp)
depth_final = dasparity_to.process(depth_hole)
我的來源是這裡:
這是拿到相機後整整五個工作天我才逐漸掌握了怎麼轉譯從C++到python
開始把這個範例作為接下來開發的基底
var = rs.frame.get_frame_number(color_frame)
print 'frame number: '+ str(var)
time_stamp = rs.frame.get_timestamp(color_frame)
time = datetime.now()
print 'timestamp: ' + str(time_stamp)
domain = rs.frame.get_frame_timestamp_domain(color_frame)
print domain
meta = rs.frame.get_data(color_frame)
print 'metadata: ' + str(meta)
視覺化
在python裡面的套件,適合用的就是opencv,在官方也是用這個
當然還有rosbag跟其他matlab等等,我主要用opencv後來用matplotlib作為尺規做圖
所以 前面提過 pip install opencv-python
然後import cv2
color_cvt = cv2.cvtColor(color_image,cv2.COLOR_RGB2BGR) #convert color to correct
cv2.namedWindow("Color Stream", cv2.WINDOW_AUTOSIZE)
cv2.imshow("Color Stream",color_image)
cv2.imshow("Depth Stream", depth_color_image)
key = cv2.waitKey(1)
# if pressed escape exit program
if key == 27:
cv2.destroyAllWindows()
Break
我先前提過 BGR是opencv預設的打開模式,所以我錄製rgb要轉成bgr
然後設定視窗
waitKey是每個畫面幾毫秒
然後按esc的時候關閉
matplotlib更簡單
plt.imshow(img)
plt.show()
這樣就可以顯示出圖片了
到這裡之後就可以看到畫面了
要做成影片就是範例裡面的
try:
while True:
然後用wait for frames就可以拿到資料
然後再用opencv 每毫秒更新就是影片了
不過其實stream在跑的時候 不論有沒有wait for frame他都一直在傳資料了
這就是我這個專案的基礎了,接下來就可以開始計算3D距離了


Comments
Post a Comment